
Git as a graph. Part 1
If you’ve come here, you have either been told about git for the first time and are wondering what it is, how to use it and why it is useful or you are an already existing git user, looking to expand your knowledge. As a quick explanation for the newer readers, git
- Is a tool that tracks changes to codebases.
- Provides a CLI but lots of editors and IDEs have integrated it graphically.
- Is extremly useful for collaborative work, for example through Github. Furthermore you will also find it being used at a lot of software development companies.
This blog post aims to introduce its readers a (probably) new way of thinking about git and to teach new readers how to use git in the first place.
Why yet another blog bost? think-like-a-git.net is a thing!
think-like-a-git.net surely is a well written and
awesome ressource and if you already know a little git you should definitely check it out.
However this blog post is aimed at readers that have never heard of git before
and as think-like-a-git.net shows on their own website:
 However I believe that just showing new git users an image like
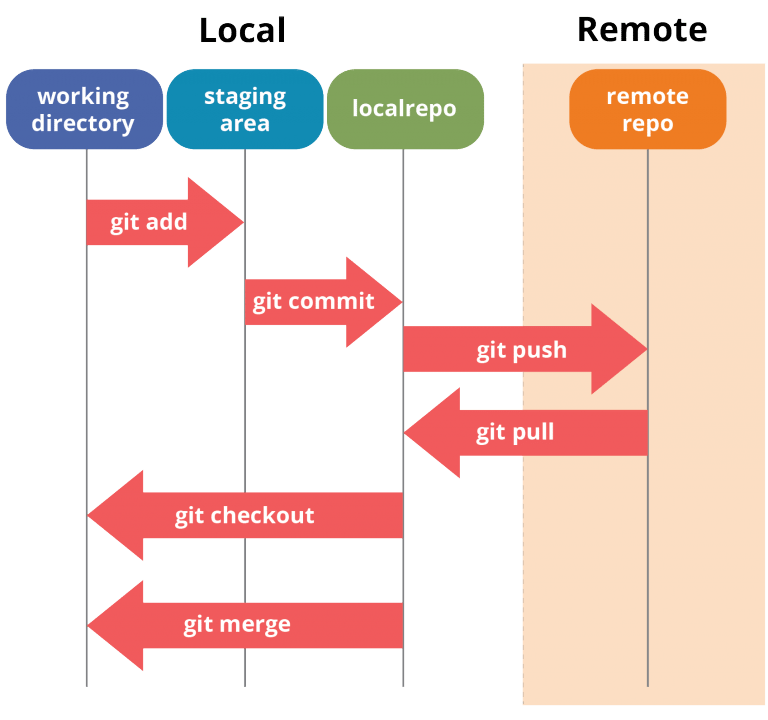 then talking a little about the commands shown here before leaving them
alone to explore the rest of git themselves, should they want to know about it,
is not the right way to teach git. What I want to do instead is to build a git
understanding from the ground up, based on the fact that it’s a graph.
then talking a little about the commands shown here before leaving them
alone to explore the rest of git themselves, should they want to know about it,
is not the right way to teach git. What I want to do instead is to build a git
understanding from the ground up, based on the fact that it’s a graph.
But what is a graph?
What most readers probably think about when hearing “graph” is the graph of a mathematical function or some data, this is however not the type of graph git is based on. The graph’s we’ll be talking about are a field of mathematics of its own, called graph theory and have various applications in computer science, far beyond git.
Graphs are a type of data structure consisting of two things
- Nodes, these can for example represent a city, a certain step in a work process etc. and might have data associated with them such as the name of the city.
- Edges (also referred to as lines or links), these connect the nodes to each other, they can have a direction (or no direction, i.e bidirectional) and a weight associated with them, for example the distance between two cities.
This very simple data structure can for example be used to model a network of cities (or a computer network) and find the shortest path from A to B by looking at the weights of graphs.
But git is for tracking changes to code bases, how is this related?
In order to answer this question we have to understand what “change” really means
to git. When git users talk about a change what they usually mean is a so called
diff, diff(1) is a tool that has been around since 1974 and can be used to
compare files, it works as follows. Consider the following file content:
Hello Git Users
This is our example file
Now if we make a copy of this file and edit it a little, for example like this:
Hello Git Users
This is our modified example file
With a new line
And call diff file1.txt file2.txt diff will output the following:
2c2,3
< This is our example file
---
> This is our modified example file
> With a new line
How do we have to interpret this output? 2c2,3 tells us where the diff starts, i.e.
line 2, it also tells us that line 2 was c(hanged) to line 2 and 3. Below that
we can see the line that was changed/deleted (denoted by <), then — as an seperator
between the old and the new lines, followed by the new lines (denoted by >).
What git refers to as a “commit” to a code base is essentially a collection of diffs just like this, together with information to which files this diff refers to and who created the commit. Now you might ask yourself a few questions,
- How does git know which commits are followed by which?
- If 10 people work on the same code base on their own machine, how does git manage to merge these all together in the end?
- And a few more that don’t come to my mind right now
Luckily most of these can simply be answered with “the magic of graph theory”.
Commits as nodes of a graph
In the end a git commit does nothing more than a node inside a graph, with edges pointing to other, later commits. These commits usually have the following information attached to them:
- A set of diffs
- The list of files these diffs were applied to
- Information about the author (name, email etc.)
- Which commits are the ones preceeding this one (yes one commit can have multiple, direct predecessors)
- When the commit was made
A very simple commit history might look like this:
The thing that stands out in this image clearly, are the seemingly random combinations of numbers and characters at the begin of each commit. These are called hashes, produced by a so called hashing algorithm. A hashing algorithm takes a certain, arbitrarily sized input and maps it to a certain fixed-sized output (note that sometimes two or more inputs can map to the same output). The random sequences up there are the first few hexadecimal characters produced by the SHA-1 algorithm, applied to all information related to a commit, a full git commit hash is in fact 160 bits (or 20 hex characters) long. Furthermore the SHA-1 hashing algorithm is a so called cryptographic hashing algorithm which gives it (among others) another nice property, its output is seemingly randomly distributed. This makes the hash ideal to uniquely identify a git commit among all its predecessors and all the commits that might come (see here for an article that talks about the probability of two commit hashes ever being the same).
So that’s question one answered already! To the more practical readers this might have been a little dry so let’s see how we can apply what we just learned.
First off we have to create a new git repository, if you already have a git repository
at, for example github.com you can use git clone <github URL> in order to download
it on to your PC. Otherwise you will have to create a new directory, cd into it
and create a new git repository with git init.
Both give us a new graph to work with we can make commits to. Afterwards you want to tell git your name and email with
 git config --global user.name "Your name here"
 git config --global user.email "your_email@example.com"
Just in case some one is going to see your commits in the future and wants to contact
you or talk to you about them. Afterwards you can go ahead and add a few new files,
make changes to them etc. Once you got that done you can start adding your files to
what git calls the “index”, this is a list of files you want to track using git.
This is quite simply done with git add file or git add directory which will add
all files in a directory to the index (note that empty directories can’t be tracked).
Once you got all files you want to add to the next commit added you can run
git commit in order to package all the diffs to each file into one commit.
This will by default open the vim editor to let you type a commit message,
if you want to avoid this you can also pass one from the command line you can run
git commit -m "My first commit". Afterwards you can make a few changes to your
files (or add new ones) and run git add on them again (also on the ones you modified,
in order to tell to git that you want to package the diff to these files into the
next commit as well), then commit once more. If you run git log now (which, surprise
shows us the log of our git repository) you will see your two new commits.
What you might notice there as well is that your most recent commits looks like this:
commit 1f08062c27dc3f14d537e6c13eefb102ae563bad (HEAD -> master)
Author: Henrik <hargonix@gmail.com>
Date:  Some date
    Some commit message.
The keyword HEAD refers to the commit you are currently on as git allows you to
check out older versions of your graph with git checkout commit-hash or
git checkout HEAD~1 in order to check out the commit before HEAD. The -> master
tells us that HEAD is currently pointing to our master branch, but what is a branch?
Branches, where graph theory becomes useful
The structure we created above though, does not justify using something as complex as a graph in order to track changes, after all right now this is just a single chain of commits pointing after each other, so why do we need a graph for this?
Consider the following situation, you have cloned a git repository, say, from Github, and want to make a change to it. However there are a lot of other people wanting to make changes to it as well; this would end up in a giant mess in the end because everyone wants their commits to land in one line right? Git addresses this issue with a very simple feature called a branch. Branching allows you to split off the main codeline (usually the master branch), conduct your own development seperately from the main project and when you are done making those changes, merge your changes back in. This process will usually look like this:
Another wonderful thing about this is that you can for example maintain your completely own version of the repository, this is because branching really just means having 1 commit that is followed by 2 (or more) instead of just 1 commit. This nice property allows us to do something like the following:
What you should also keep in mind when using branches is that the branch names (in this case master, my-version and my-feature) are nothing special, they are just labels pointing to the most recent commit hash of a certain branch and nothing more. This means checking out the most recent commit hash of your branch is fully equivalent to checking out the branch.
For the more practical readers, we will now create a simple feature branch off our test repository, add a few commits and then merge it back in. The git CLI makes this incredibly simple for us to do.
In order to create a new branch, you can use the git checkout command like this
git checkout -b new-branch, this will create a new branch and immediately switch
to it for us. Once you are in the new branch you can start making commits for your
fancy new feature. After you are done with that we want to switch back to our master
branch by simply doing git checkout master (we don’t have to do the -b option here
as the branch already exists). You can now merge your new-branch into your master branch
by simply doing a git merge new-branch. Afterwards you can look at the output
of git log --graph and should see a diagram similar to the first one in this section,
except that of course, it has only got one branch.